



Most panel conversations die the same way. Someone pulls a number from a benchmark deck — "2,100 patients per PCP" or "1,500 for complex panels" — writes it into a staffing plan, and then everyone acts surprised six months later when the schedule is jammed, providers are drowning, and patients keep getting bounced to whoever has an open slot. The number wasn't wrong exactly. It just wasn't connected to anything real.
Panel sizing isn't a single figure. It's an operating model — a set of linked decisions about how many patients a provider carries, how much of their calendar is protected for their own panel, how visit types get allocated, and how you actually measure whether continuity is holding. When those pieces aren't wired together, the panel number becomes a vanity metric. On paper everyone looks appropriately loaded. In practice, continuity quietly erodes because the scheduling rules underneath contradict the panel math on top.
This is a walkthrough of how the whole system fits together, where it breaks as a clinic grows, and the actual formulas, policies, and monthly ritual you need to keep relationship continuity intact while still hitting capacity targets.
Why a single panel number falls apart
The core problem: panel size is an output, not an input. You can't assign 1,800 patients and expect the calendar to cooperate. The real constraint is visit demand per year, and that varies enormously by panel composition.
A panel of mostly healthy 30-year-olds generates maybe 2–3 visits per patient per year. A panel heavy with poorly controlled diabetes, CHF, and multiple comorbidities can hit 5–7. Same headcount, wildly different load. When a clinic uses one flat panel target across providers, what happens is predictable: the provider with the sicker panel runs chronically over, their continuity collapses first because their own patients can't get in, and those patients spill onto other providers' schedules. Now two panels are distorted instead of one.
In practice, this usually shows up as a slow drift rather than a cliff. Continuity rates look fine in month one, slip a few points by month four, and by the time someone notices in a quarterly review, the scheduling behavior that caused it has been baked in for two quarters. The front desk has learned that "just put them with Dr. Lee, she has openings" keeps the day moving, and nobody told them that's quietly dismantling three other panels.
The fix starts with sizing the panel from demand, not from a benchmark.
The panel-sizing formula that actually ties to capacity
Here's the backbone calculation. You need four inputs per provider:
Eliminate appointment gaps and no-shows.
GoCliny streamlines every patient interaction from booking to billing—seamlessly.
- Unified appointment scheduling
- Automated patient reminders
- Staff calendar & task management
No credit card required
-
Available visit supply — visit slots the provider actually offers per year
-
Visits per patient per year — your panel's real utilization, pulled from historical data
-
Target continuity reserve — the slack you keep so your own panel can always get in
-
Visit-mix distribution — how slots split between new, acute, chronic, and follow-up
Panel size = (Annual visit supply × continuity reserve factor) ÷ visits per patient per year
A worked example. Say a full-time provider offers:
-
32 patient-facing hours/week
-
44 clinical weeks/year
-
Average 3 visits/hour (20-minute slots)
That's roughly 4,220 visit slots a year. If your panel generates about 3.2 visits per patient per year, a naive calculation says 4,220 ÷ 3.2 ≈ 1,320 patients.
But that ignores reserve. If you protect 15% of capacity for continuity buffer and same-week access, usable supply drops to around 3,590 slots, and the panel lands closer to 1,120. That ~200-patient gap between the naive and the realistic number is exactly where continuity goes to die in clinics that skip the reserve step.
The point isn't precision. It's that two providers with identical hours but different panel acuity should carry meaningfully different panel sizes — and the formula forces that conversation instead of hiding it.
Adjusting for acuity
A simple weighting approach works well enough for most small and mid-size clinics. Assign each patient a load weight:
| Panel segment | Load weight | Typical visits/yr |
|---|---|---|
| Healthy / episodic | 0.7 | 1.5–2.5 |
| One stable chronic condition | 1.0 | 3–4 |
| Multiple / uncontrolled chronic | 1.6 | 5–7 |
| High-complexity / frail | 2.2 | 7+ |
Multiply each segment's patient count by its weight to get a weighted panel load, then size against that instead of raw headcount. A provider carrying 1,100 patients that weight out to 1,450 is effectively over-paneled even though the raw number looks conservative. This is probably the single most common miss: clinics compare raw panel counts across providers, conclude the load is balanced, and the acuity-weighted picture is completely lopsided underneath.
Protected continuity slots: the policy that makes the math real
The panel formula is useless if the calendar doesn't defend it. Protected continuity slots are the mechanism — slots on a provider's schedule reserved for their own paneled patients, not bookable by the general scheduling pool until a defined release window.
The failure mode without this is brutal. A provider's calendar fills with other providers' overflow and walk-ins, their own patients can't find them, continuity drops, and the patient relationship that made the panel valuable in the first place dissolves.
A workable protected-slot policy has four parts:
-
Reserve percentage — what share of each provider's slots are panel-only (commonly 50–70% of same-week slots, lower further out)
-
Release rule — how long before the appointment protected slots open to the general pool (e.g., unused panel slots release 72 hours out)
-
Override authority — who can break the reserve and under what conditions (clinical urgency, continuity-critical visits)
-
Visit-type eligibility — which visit types can occupy protected slots
Sample protected-slot policy template
-
Protected Continuity Slot Policy
-
- 60% of slots within a 2-week horizon are reserved for panel patients of the assigned provider.
-
- Protected slots unbooked at 72 hours prior release to general scheduling.
-
- Acute/same-day demand is handled through a separate acute pool (see visit-mix below), not by raiding continuity reserves.
-
- Front desk may not override a protected slot. Overrides require clinical lead approval, logged with reason code.
-
- Exception
continuity-critical follow-ups (post-hospitalization, titration visits) may book into any protected slot within 7 days.
That override-logging line matters more than it looks. When overrides aren't tracked, the exception becomes the default within a month and nobody can see it happening. The log is what lets your monthly review catch drift before it compounds.
Log every protected-slot override with a reason code so exceptions don't become the default.
When overrides aren't tracked, the exception becomes the default within a month and nobody can see it happening.
Visit-mix allocation: dividing the calendar on purpose
Panel size and protected slots handle who. Visit-mix allocation handles what. Without it, acute demand eats continuity capacity, or follow-up visits starve because new-patient slots were over-allocated to hit growth targets.
A clean allocation splits each provider's weekly slots into buckets with caps:
-
Panel continuity (chronic + follow-up)
~45–55%
-
Acute / same-week
~20–25%
-
New patient
~10–20% (tune to growth targets)
-
Flex / buffer
~10%
The buffer bucket is the part people cut first and regret most. It absorbs overflow that would otherwise force a protected-slot override. A clinic running zero buffer isn't lean — it's one no-show cascade away from a jammed afternoon and three bumped continuity patients.
Visit-mix caps also surface a hidden growth tension. If leadership wants panel growth, they allocate more new-patient slots. But every new-patient slot is a continuity slot you didn't offer existing patients. Making that trade explicit — on the calendar, in percentages — turns a vague "we need to grow" into a decision someone actually owns. This connects directly to how you structure the broader monthly capacity-planning system for multi-provider clinics, where visit-mix sits alongside overall demand forecasting.
Reporting taxonomy: the metrics that tell you continuity is holding
You can't manage a panel model with a single continuity percentage. You need a small, stable set of metrics with clear definitions, because the fastest way to kill a reporting system is to let three people define "continuity" three different ways.
The core metrics to track:
| Metric | Definition | Watch threshold |
|---|---|---|
| Continuity rate (UPC) | % of a patient's visits with their assigned provider | < 75% |
| Provider-side continuity | % of a provider's visits that were their own panel | < 70% |
| Panel load index | Weighted panel ÷ target panel | > 1.10 |
| Protected-slot override rate | Overrides ÷ total protected slots | > 8% |
| Third-next-available (own panel) | Days to 3rd open panel slot | > 10 days |
| Spillover ratio | Panel patients seen by another provider | > 20% |
The two most underused here are override rate and own-panel third-next-available. Override rate tells you whether your protected-slot policy is actually being respected. Own-panel third-next-available tells you whether patients can reach their provider at all — because a clean continuity rate means nothing if the patients who couldn't get in simply stopped trying and churned out. Keep these definitions in one shared place so every report traces back to the same taxonomy.
The repeatable monthly ritual
A panel model is a living thing. Panels shift, acuity drifts, providers go on leave, growth targets change. Without a standing monthly review, the model you built in January is quietly wrong by April.
Data inputs (pulled before the meeting)
-
Weighted panel load per provider (updated acuity segments)
-
Continuity rate + provider-side continuity, last 30 days
-
Override log summary with reason codes
-
Own-panel third-next-available
-
Spillover ratio by provider pair
-
New-patient adds vs. target
Decision rules (applied in the meeting)
-
Panel load index > 1.10 for two consecutive months → freeze new-patient adds for that provider; redistribute incoming to under-loaded panels.
-
Provider-side continuity < 70% → audit that provider's calendar for excess spillover intake; tighten protected-slot release window.
-
Override rate > 8% → review reason codes; if acute overflow is driving it, expand the acute pool rather than the continuity raid.
-
Own-panel third-next-available > 10 days → add protected same-week slots or reassess panel size downward.
-
Spillover ratio > 20% between two providers → investigate scheduling defaults; this is almost always a front-desk routing habit, not a demand problem.
Owner RACI
| Activity | Responsible | Accountable | Consulted | Informed |
|---|---|---|---|---|
| Pull monthly data | Ops analyst | Practice manager | — | Providers |
| Review decision gates | Practice manager | Medical director | Lead provider | Front desk |
| Adjust panel targets | Practice manager | Medical director | Provider | Scheduling team |
| Update protected-slot config | Scheduling lead | Practice manager | — | Providers |
| Approve new-patient freezes | Medical director | Medical director | Practice manager | All providers |
The accountability split matters. Panel targets are a clinical-operational decision (medical director accountable), but slot configuration and routing are operational (practice manager). Blur those and you get either clinicians micromanaging the schedule or operations quietly overriding clinical judgment on acuity.
This visual summarizes the monthly ritual workflow.
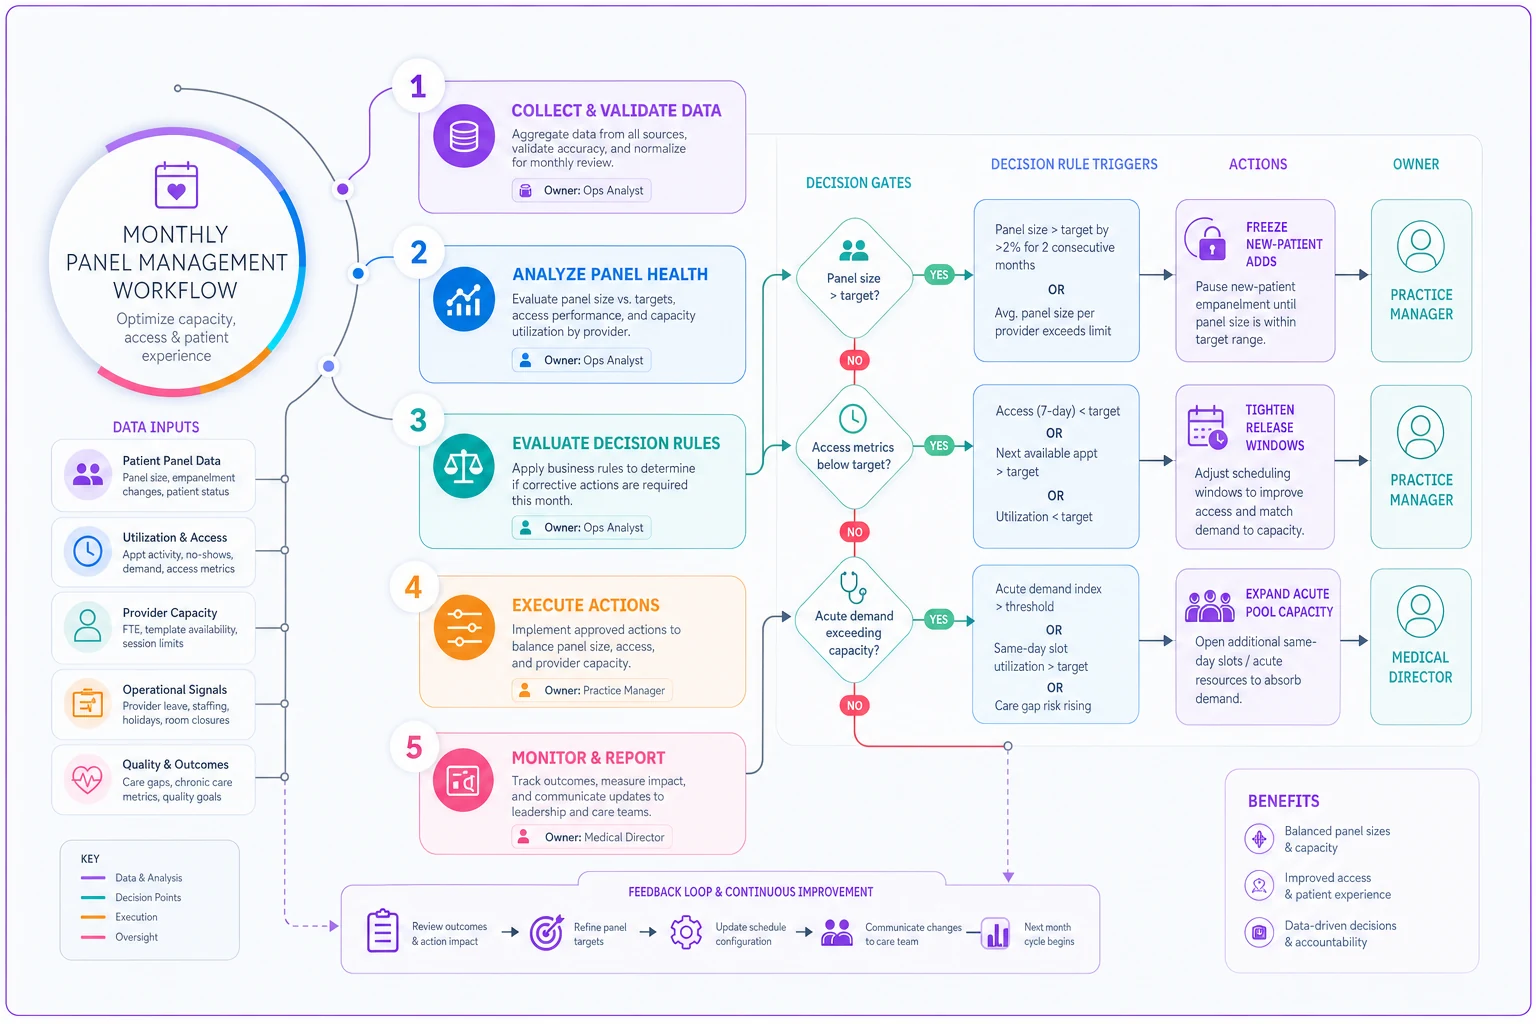
The goal is to have the decision gates fire on time, not to turn this into a heavy meeting.
A real scenario
A three-provider family medicine practice — roughly 4,000 active patients — kept hearing that patients "could never see their own doctor." Continuity rate sat around 68% and dropping. On paper, panels looked balanced at about 1,350 each.
The weighted-load view told a different story. One provider had absorbed most of the clinic's complex diabetic and CHF patients over the years — her weighted load was nearly 1,600 equivalent, while a newer provider weighted out around 1,150. Her own-panel third-next-available had crept to 14 days, so her patients were getting routed to whoever was open, dragging everyone's continuity down with it.
They did three things:
-
rebalanced new-patient intake entirely toward the under-loaded provider
-
set protected continuity reserves at 60% within two weeks
-
added an acute pool so same-day demand stopped eating continuity slots
Nothing exotic. Within about three months, continuity climbed back to the high 70s, the overloaded provider's own-panel access dropped under a week, and the complaints at the front desk fell off noticeably. No new hires — just the calendar doing what the panel math said it should.
When this model makes sense — and when it doesn't
When it's worth the effort: multi-provider primary care, pediatrics, and any longitudinal care setting where the patient-provider relationship drives outcomes and revenue. If continuity is part of your value proposition, you need this.
When it's overkill: single-provider practices (the panel is the practice), urgent care, and purely episodic specialties where patients don't have an assigned provider in any meaningful sense. Forcing protected-slot policies onto a walk-in model just creates artificial scarcity.
Who should not start here: clinics whose scheduling data is a mess. If you can't reliably tell which visits were with the assigned provider, fix attribution and your appointment data first — a solid appointment lifecycle with clear SLAs and handoffs has to exist before panel reporting means anything. Building a panel model on bad scheduling data just automates wrong conclusions.
Where the system tends to break at scale
Everything above holds together reasonably well with three providers at one site. Add sites, add providers, add a growth mandate, and new failure points appear:
-
Attribution lag — panel assignments go stale as patients move, switch providers informally, or get "temporarily" reassigned during a leave that never ends. Stale attribution quietly corrupts every continuity metric downstream.
-
Cross-site spillover — multi-site clinics start routing patients to whichever location has capacity, which helps access but shreds continuity if nobody's watching the spillover ratio across sites.
-
Manual reporting debt — pulling six metrics across five providers by hand every month works until it doesn't. It gets skipped during busy stretches, which is exactly when drift accelerates.
-
Waitlist pressure — when demand outpaces supply, the pressure to book patients anywhere becomes overwhelming, and protected slots are the first casualty. Pairing panel sizing with disciplined waitlist prioritization and auto-allocation rules keeps access and continuity from working against each other.
This is the point where clinics usually reach for better tooling. The monthly ritual, override logs, weighted-load calculations, and threshold alerts are all things that can be configured once inside an operational platform and run automatically — so the panel model stays current without someone rebuilding spreadsheets every month, and threshold breaches surface as alerts instead of being discovered two quarters late. The goal isn't automation for its own sake; it's keeping the data fresh enough that the decision gates actually fire on time.
Pulling it together
Panel sizing fails when it's treated as a number instead of a system. The number on its own — 1,200, 1,500, 1,800 — tells you almost nothing. What actually protects continuity is the chain underneath it: sizing from real demand and acuity, defending that size with protected slots, allocating the calendar deliberately, measuring the handful of metrics that reveal drift, and running a monthly ritual with clear owners who are allowed to pull the levers.
Get those linked and the panel becomes self-correcting. Leave gaps between them and continuity erodes in the quiet places — the front-desk shortcut, the override nobody logged, the acuity that crept up while the panel count stayed flat. The clinics that keep patients with their providers aren't the ones with the perfect benchmark number. They're the ones whose scheduling behavior and panel math are telling the same story every single month.
Ready to transform your practice workflow?
Join 2,000+ healthcare providers using GoCliny to increase efficiency, improve patient satisfaction, and grow revenue.