


Most clinics don't have a data problem. They have a trust problem. The dashboards exist. The KPIs are on a screen somewhere. But when a number looks off, nobody acts on it — they argue about whether it's real. And by the time someone confirms the no-show rate actually jumped last month, the schedule's already baked for the next six weeks.
That gap between "we have data" and "we make decisions from data" is what a clinic analytics operating model is supposed to close. Not more reports. Not a prettier dashboard. A repeatable structure that answers four boring but critical questions: What counts as this metric? Who owns it? How do we know it's right? And when do we actually sit down and decide something based on it?
This piece is about the operating model itself — the plumbing and the rituals — not the individual KPIs. If you want the metric list and the taxonomy, that's covered in the clinic KPI taxonomy with owner matrices and validation checks. Here we're focused on the operating layer that sits on top of any metric set and keeps it alive.
Why clinic analytics quietly rot
A practice manager builds a dashboard. It's great for about three months. Then someone changes how appointments get coded in the scheduling system, and the "new patient" count silently drifts. Nobody notices until a provider says "there's no way we only saw 12 new patients last week." Trust evaporates in a single meeting.
The root cause is almost never the tool. It's that nobody defined the object underneath the number. What is a "visit"? Is a telehealth no-show a no-show, or a cancellation, or neither? Does a rescheduled appointment count twice? When two people pull "visits this month" and get different answers, it's because they're counting two different things — and both think they're right.
This usually breaks at a predictable moment: the clinic adds a second provider, or a second location, or a new service line. Suddenly the shortcuts that worked when one person did all the reporting break, because now three people are counting independently and none of them wrote down the rules.
So before you touch star schemas or RACI charts, you have to agree on the nouns.
Start with canonical clinic objects
A canonical object is just the agreed-upon definition of a thing your clinic measures. Everyone references the same definition, and all KPIs get built on top of them. This sounds obvious. Almost nobody does it.
Eliminate appointment gaps and no-shows.
GoCliny streamlines every patient interaction from booking to billing—seamlessly.
- Unified appointment scheduling
- Automated patient reminders
- Staff calendar & task management
No credit card required
For most small and mid-size clinics, you need maybe seven to ten canonical objects — not fifty. The usual core set:
-
Patient — a unique human, deduplicated. (The number one source of garbage data is the same patient existing three times.)
-
Encounter / Visit — a single completed interaction with a provider, with a clear status: completed, no-show, cancelled, rescheduled.
-
Appointment — the scheduled slot, which is not the same as an encounter. One appointment can become zero or one encounters.
-
Provider — the rendering clinician, distinct from the scheduling resource.
-
Claim — the billing artifact tied to an encounter.
-
Payment — money received, tied to a claim or a patient balance.
-
Referral — inbound or outbound, with a source and a status.
The discipline is this: write a one-sentence definition for each, plus the edge cases. "An Encounter is counted as completed when the provider signs the note. A no-show is an appointment where the patient never arrived and the slot wasn't backfilled. A cancellation more than 24 hours out is not a no-show."
Start by writing the one-sentence definitions for Patient, Encounter, and Appointment — they resolve most early disagreements.
Those edge-case rules are the whole ballgame. A typical breakdown: a clinic counts no-shows at the front desk by marking a status, but the billing team counts them off unbilled slots. The two numbers are always off by 10–15%, and every monthly meeting wastes twenty minutes reconciling them instead of fixing the actual problem.
Once the objects are defined, the data model gets much simpler — because now you're modeling agreed-upon things, not arguing about them.
Minimal star-schema guidance (keep it embarrassingly simple)
You don't need a data warehouse team. You need a clean, small star schema that a non-technical manager can actually read. The goal is a shape, not an engineering project.
Fact tables hold events — things that happened, like a visit, a payment, a claim. Dimension tables hold the descriptive context: who the provider is, what the location is, what the date is. You join facts to dimensions to answer questions.
A workable minimal model for a clinic:
| Table | Type | What it holds | Example columns |
|---|---|---|---|
fact_encounter | Fact | One row per completed/no-show/cancelled visit | encounterid, patientid, providerid, locationid, dateid, status, visittype |
fact_payment | Fact | One row per payment received | paymentid, claimid, patientid, dateid, amount, payer_id |
fact_claim | Fact | One row per submitted claim | claimid, encounterid, payerid, submitdateid, status, billedamount |
dim_patient | Dimension | One row per unique patient | patientid, ageband, zip, panelproviderid |
dim_provider | Dimension | One row per provider | provider_id, specialty, fte |
dim_date | Dimension | One row per calendar day | dateid, week, month, quarter, isholiday |
dim_location | Dimension | One row per site | locationid, sitename, region |
That's it. Most clinic KPIs — no-show rate, net collection rate, new patient volume, provider utilization — can be built from those seven tables. The discipline that matters: every fact joins back to the canonical objects you defined. If a number can't be traced to a fact row, it's not a KPI, it's an opinion.
The common mistake is over-engineering. People try to model every clinical nuance and end up with forty tables nobody maintains. Start with the shape above, and if you want the broader thinking on how data flows into a model like this without a big IT budget, the pragmatic data and integration architecture for SMB clinics covers the connective tissue.
Owner SLAs and a real RACI
A KPI without an owner is a rumor. The single biggest reason dashboards get ignored is that when a number looks bad, there's no agreed person whose job it is to care.
Each canonical object and each KPI needs an owner — and the owner has an SLA. Not a vague "keeps an eye on it." A specific commitment: how fresh the data must be, how fast they investigate an anomaly, and who they escalate to.
A simple RACI for the analytics operating model:
| Activity | Responsible | Accountable | Consulted | Informed |
|---|---|---|---|---|
| Define canonical objects | Practice Manager | Clinic Owner/MD | Billing Lead, Front Desk Lead | All staff |
| Data freshness & load checks | Ops Analyst / PM | Practice Manager | IT/vendor | Providers |
| KPI anomaly investigation | KPI Owner | Practice Manager | Relevant team lead | Owner/MD |
| Monthly decision meeting | Practice Manager | Clinic Owner/MD | Providers, Billing | All staff |
| Incident logging | Whoever finds it | Practice Manager | — | KPI Owner |
Sample owner SLAs that actually work in practice:
-
Front desk no-show data — refreshed daily by 9am; owner investigates any day-over-day swing greater than roughly 30% within one business day.
-
Net collection rate — refreshed weekly; billing lead investigates any drop of more than 3 points within three business days.
-
New patient volume — refreshed weekly; owner flags anything outside the normal seasonal band before the monthly meeting.
The thing most clinics miss: the SLA isn't about speed for its own sake. It's about making sure nobody can say "I didn't know that was my job" in the monthly meeting. Once ownership is written down, the conversation shifts from whose fault is this number to what do we do about it.
Lightweight validation rituals (so nobody argues about whether the data is real)
You cannot act on data you don't trust, and you cannot trust data you don't test. But clinics don't have QA engineers — so validation has to be lightweight. Checks that take minutes, run on a schedule, and fail loudly.
The point isn't perfection. It's catching the obvious breakages before they poison a decision. A few validation tests that catch the vast majority of real-world problems:
-
Row-count sanity — Did
fact_encounterget roughly the expected number of new rows this week? If the last four weeks averaged around 310 encounters and this week shows 40, something didn't load. -
Orphan check — Every claim should join to an encounter. Count claims with no matching encounter. Should be zero.
-
Status completeness — Every appointment past its date should have a terminal status (completed/no-show/cancelled). Anything stuck in "scheduled" in the past means front-desk workflow drift.
-
Duplicate patient check — Flag patients with identical name + DOB but different IDs. This is the single highest-value test in most clinics.
-
Reconciliation to source — Monthly, does total payments in
fact_paymentmatch the bank deposit total within a small tolerance? If the warehouse says $148k and the deposits say $161k, you have a pipeline gap.
Run these automatically if you can, manually if you can't. The ritual is what matters: a short weekly check where someone confirms the greens are green before anyone looks at a KPI. A clinic that spends fifteen minutes on validation every Monday saves itself from walking into a decision meeting with numbers that fall apart under the first question.
One thing worth naming: validation failures are usually workflow signals in disguise. A spike in "appointments stuck in scheduled" almost always means a front-desk process changed — a new hire, a new shortcut, a template that stopped getting updated. The data test catches operational drift faster than any supervisor would.
Incident logging: treat bad data like a clinical event
When a number turns out to be wrong, most clinics fix it quietly and move on. That's a mistake, because the same breakage recurs three months later and everyone acts surprised again.
Borrow the discipline from clinical incident reporting: when a data issue is found, it gets logged. Short, structured, non-punitive. An incident log entry doesn't need to be fancy — a shared sheet works:
-
Date found / who found it
-
What broke (e.g., "new patient count under-reported for 2 weeks")
-
Root cause (e.g., "scheduling template changed visit_type coding")
-
Impact (e.g., "capacity planning used wrong demand estimate")
-
Fix applied
-
Prevention (e.g., "added validation test for visit_type distribution")
A sample incident-playbook template, kept to one page:
-
Incident KPI shows an impossible or implausible value.
-
Step 1 — Contain Flag the KPI as "under review" on the dashboard so nobody acts on it.
-
Step 2 — Trace Owner checks the validation tests, then the source system, then the load.
-
Step 3 — Classify Source error, pipeline error, or definition error?
-
Step 4 — Fix + backfill Correct the data; note the affected date range.
-
Step 5 — Prevent Add or tighten a validation test so this specific failure fails loudly next time.
-
Step 6 — Log + close Record it. Mention it at the next monthly meeting.
The payoff compounds. After six months of logging, you have a map of exactly where your data is fragile — which is also a map of where your operations are fragile. Clinics that keep this log stop having the same argument twice.
The monthly decisioning cadence
Canonical objects, a clean schema, owners with SLAs, validation, incident logs — none of it matters if there's no recurring moment where the numbers turn into decisions. The monthly decisioning cadence is the ritual that maps your KPI taxonomy to actual operational moves.
The structure that works for most multi-provider clinics:
-
Pre-meeting (owner prep, 2 days before) Each KPI owner confirms validation is green, reviews their metrics, and writes a one-line interpretation — not just the number, but what it means and what they propose.
-
The meeting (60–75 minutes) Go metric by metric, but only linger on the ones outside their expected band. A KPI inside its normal range gets a ten-second confirmation and you move on.
-
Decision + owner + date Every out-of-band metric produces a decision with a named owner and a check-back date. "No-show rate climbed to around 14% at the north location — front desk lead to pilot a reminder cadence change, review in 4 weeks."
-
Carry-forward log Last month's decisions get reviewed first. Did they work? This closes the loop and stops the meeting from becoming a monthly venting session.
The critical design choice: the meeting is for decisions, not for reporting. If people are seeing the numbers for the first time in the room, you've already lost. The numbers should be known and trusted before anyone sits down — that's what all the prior plumbing buys you. For the connection between which metrics actually belong in this room and how they trigger action, the thinking in which KPIs actually move the needle and trigger actions pairs directly with this cadence.
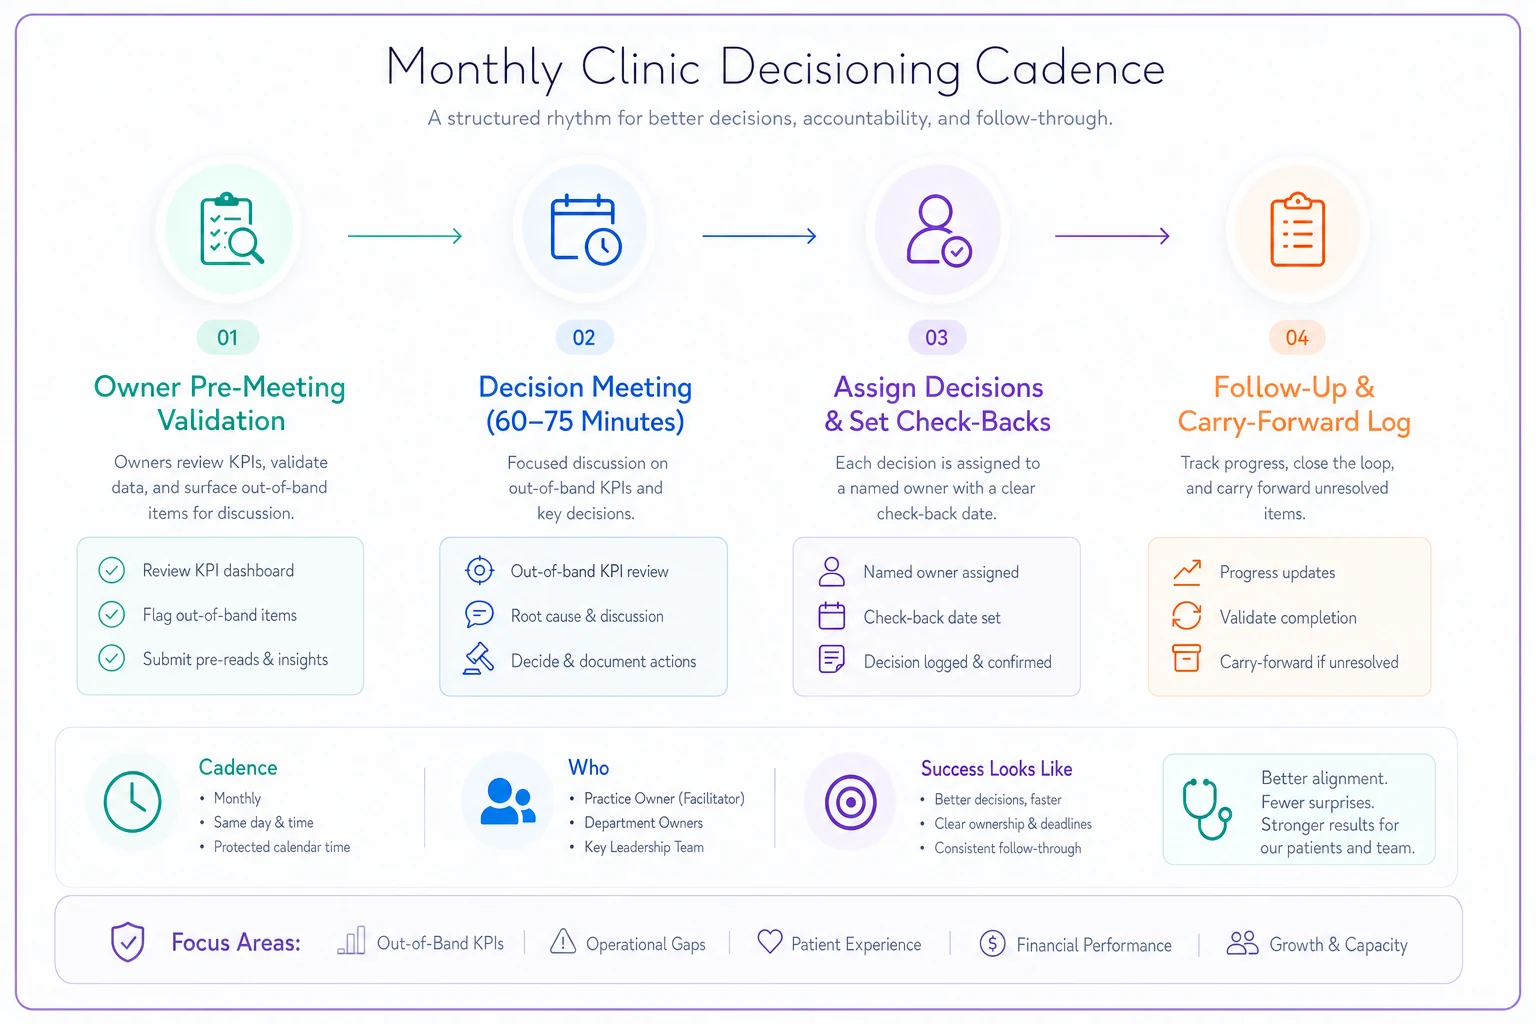
This flow shows why prep, validation, and a carry-forward mechanism are all required for meetings to produce action.
Mapping KPI taxonomy to operational rituals
The whole system is a chain of translation. A taxonomy groups metrics into categories — access, financial, clinical throughput, patient experience. Each category maps to a ritual and an owner:
| KPI category | Example metric | Owner | Ritual it feeds |
|---|---|---|---|
| Access | New patient lead time, no-show rate | Front Desk Lead | Weekly scheduling huddle + monthly decision |
| Financial | Net collection rate, days in A/R | Billing Lead | Weekly A/R review + monthly decision |
| Throughput | Provider utilization, visits/day | Practice Manager | Monthly capacity planning |
| Experience | Survey score, complaint volume | Practice Manager | Monthly decision |
This mapping is what stops KPIs from being decorative. Every metric has a home — an owner, a cadence, and a decision it's allowed to influence. A number that doesn't map to any ritual probably shouldn't be on the dashboard at all.
When this makes sense — and when it doesn't
When this is worth building: You have two or more providers, more than one person touching reporting, or you've already had the "our numbers disagree" meeting. At that scale, informal reporting quietly fails and the operating model pays for itself quickly.
When it's overkill: A true solo practice where one person sees everything and schedules everything. If you're doing roughly 200 visits a month and you personally know every patient, a lightweight spreadsheet with a couple of validation checks is plenty. Don't build a RACI for an audience of one.
Who should NOT do this yet: Clinics whose source data is genuinely broken at the point of entry. If your front desk isn't consistently recording appointment statuses, no schema fixes that. Clean up the entry workflow first, then build the analytics layer on top. Modeling garbage faster just produces confident wrong answers.
A real scenario
A three-provider primary care clinic — roughly 330 monthly encounters across two locations — kept making capacity decisions off a no-show rate that nobody fully believed. Front desk said around 9%. Billing's unbilled-slot math said closer to 15%. Every monthly meeting burned twenty minutes on which was right, and they never actually changed anything.
They did three things. Defined "no-show" as a single canonical object with explicit edge-case rules. Assigned the front desk lead as owner with a daily freshness SLA. Added two validation tests — status completeness and a reconciliation between front-desk statuses and unbilled slots.
Within the first month the gap closed: the real number was around 13%, and the discrepancy had been rescheduled appointments getting double-counted. With a number everyone trusted, the monthly meeting finally produced an actual decision — a reminder cadence change at the higher-no-show location. A quarter later the no-show rate at that site had dropped a few points, worth roughly $2.5k–$3k a month in recovered slots. The real win wasn't the dashboard. It was that people stopped arguing about the data and started acting on it.
Implementation checklist
The checklist below lists the key actionable steps to implement the operating model.
-
- [ ] Write one-sentence definitions for 7–10 canonical objects, including edge cases
-
- [ ] Build the minimal star schema — facts for encounters, claims, payments; dimensions for patient, provider, date, location
-
- [ ] Confirm every fact row traces back to a canonical object
-
- [ ] Assign an owner and a freshness/investigation SLA to each KPI
-
- [ ] Write a one-page RACI for the analytics model itself
-
- [ ] Stand up 4–6 lightweight validation tests that fail loudly
-
- [ ] Run a weekly validation ritual (15 minutes, greens confirmed before anyone reads KPIs)
-
- [ ] Create an incident log and a one-page incident playbook
-
- [ ] Map each KPI category to an owner and a ritual
-
- [ ] Run the monthly decisioning cadence with pre-meeting prep and a carry-forward log
-
- [ ] Review prior decisions first, every single month
Run through these items and make them institutional — the effort pays back quickly in fewer wasted meetings and more decisions that stick.
A clinic analytics operating model isn't a technology purchase. It's a set of agreements — about what things mean, who owns them, how you know they're true, and when you decide. The schema and the tooling are the easy part. The hard part, and the part that actually determines whether anyone acts on the numbers, is the discipline around them.
Clinics that get this right stop treating data as a monthly report card and start treating it as an operating instrument. The dashboard stops being a thing you glance at and feel vaguely guilty about, and becomes the thing the whole team trusts enough to change the schedule, chase the A/R, and fix the workflow. That trust is the entire product. Everything else is plumbing in service of it.
Ready to transform your practice workflow?
Join 2,000+ healthcare providers using GoCliny to increase efficiency, improve patient satisfaction, and grow revenue.