


Most clinics don't have a metrics problem. They have a trust problem.
The dashboard says no-show rate is 8%. The front desk swears it's closer to 15%. The biller pulls her own spreadsheet and gets a third number. By the time everyone's done arguing about whose number is right, the meeting's over and nobody decided anything. That's the real failure — not that the data was wrong, but that nobody trusted it enough to act.
A clinic KPI taxonomy fixes this at the root. Not by adding more charts, but by nailing down what each metric means, who owns it, how fresh it has to be, and how you catch it when it silently breaks. This is the boring plumbing work that makes everything downstream — capacity planning, revenue cycle, staffing — actually reliable.
Why "everyone's number is different" happens
Nobody wants to admit this, but the metric definitions were never written down. They live in people's heads, and every head has a slightly different version.
Take something that sounds simple — "new patient." One clinic counts a patient as new if they've never been seen. Another counts them new if it's been three or more years since their last visit, which is how a lot of payers define it for coding purposes. The scheduler uses one rule, the biller uses another, and the marketing report uses a third because it's pulling from the CRM instead of the EHR. All three are "new patient count." All three are different numbers.
Multiply that across 30–40 operational metrics and you get a reporting environment where every number is technically defensible and none of them agree. This usually surfaces when a clinic hits its first real growth wall — adding a second location or a third provider — and the informal shared understanding breaks down because there are too many people involved.
-
Definitions are implicit, not documented
-
No single person owns the metric, so nobody fixes it when it drifts
-
Data refreshes on an unknown schedule, so people don't know if they're looking at today or last Tuesday
-
Nothing checks the pipeline, so a broken feed can run for weeks before anyone notices
Each of these is survivable on its own. Together they quietly kill trust in the whole dashboard.
The four pieces of a taxonomy that actually works
A useful clinic KPI taxonomy is more than a list of metrics. It's four connected layers, and skipping any one of them is where most clinics go wrong.
Eliminate appointment gaps and no-shows.
GoCliny streamlines every patient interaction from booking to billing—seamlessly.
- Unified appointment scheduling
- Automated patient reminders
- Staff calendar & task management
No credit card required
1. The metric definition — an unambiguous, written spec for what the number is. 2. The owner (RACI) — who's Responsible for the number, who's Accountable, who gets Consulted, who's Informed. 3. The data-refresh SLA — how current the number is guaranteed to be, and what happens when that guarantee breaks. 4. The validation checks — automated tests that catch bad data before humans do.
If you've already built an operational dashboard that triggers actions, the taxonomy is what sits underneath it. The dashboard tells you what to do; the taxonomy is what makes the dashboard believable.
Layer one: writing definitions that survive an argument
A good metric definition answers five questions before anyone can argue:
-
What exactly is being counted or measured?
-
What's included and what's explicitly excluded?
-
What's the time window, and is it based on service date, post date, or booking date?
-
What's the data source of record?
-
How is it calculated, formula and all?
Here's what a real one looks like for a metric people constantly fight about:
-
Metric
No-show rate
-
- Definition Scheduled appointments where the patient neither arrived nor cancelled, divided by total scheduled appointments in the period.
-
- Included In-person and telehealth visits.
-
- Excluded Clinic-initiated cancellations, provider call-outs, appointments rescheduled more than 24 hours in advance.
-
- Time basis Appointment date (not booking date).
-
- Source of record EHR appointment status field, status = "No Show."
-
- Formula
count(status = 'No Show') / count(all scheduled appointments)
That excluded line is doing most of the heavy lifting. Most no-show disputes come from clinic-initiated cancellations getting mixed into the patient no-show bucket. Write it down once and the argument stops happening.
A definition isn't finished until it settles a disagreement. If two people can still read it and count differently, it's not done. Write your definitions specifically to close the gaps where people currently diverge.
Layer two: owner matrices, or why "the data team owns it" is a trap
The most common mistake is assigning every metric to whoever runs reports. That person can produce the number, but they usually can't fix the thing driving it. If no-show rate is spiking, the analyst can't drive it down — the front desk and the scheduling workflow do.
Ownership needs to split cleanly. A lightweight RACI works well here:
| Role | Who it usually is | What they actually do |
|---|---|---|
| Responsible | The person who works the underlying process | Owns the day-to-day driver of the metric (e.g., front desk lead for no-shows) |
| Accountable | Practice manager / clinic director | Answers for the number in meetings, decides on actions |
| Consulted | Data/analyst or EHR admin | Confirms the number is calculated correctly |
| Informed | Providers, ownership | Sees the result, doesn't manage it |
The distinction that matters most is Responsible vs. Consulted. The analyst is consulted on whether the metric is measured correctly — they are not responsible for the number moving. When you blur those, you get the classic dysfunction where the analyst gets blamed for a rising denial rate they have zero control over, and the actual owner of the billing process quietly escapes accountability.
For revenue metrics specifically, this connects directly to the ownership roles in a proper revenue-cycle framework — clean claims rate, days in AR, denial rate all need a named human responsible for the process, not just someone who pulls the report.
Ownership assignments also need a review cadence. Staff turn over. A front desk lead who owned the no-show metric leaves, and if nobody updates the matrix, that metric becomes effectively unowned within a few months.
Layer three: refresh SLAs, so nobody's guessing how old the number is
This failure mode is almost invisible until it burns you. A clinic runs its Monday morning huddle off a dashboard. Everyone assumes it's showing weekend numbers. But the overnight data job failed Friday, and the dashboard has been quietly sitting on Thursday's data for three days. Decisions get made on stale numbers, and nobody knows.
A refresh SLA fixes this by making freshness a promise with consequences. For each metric or data feed, you specify:
-
Refresh frequency How often the underlying data updates (real-time, hourly, nightly, weekly).
-
Freshness guarantee The maximum acceptable age of the data when someone looks at it.
-
Staleness alert What triggers a warning when the data is older than promised.
-
Fallback behavior What the dashboard shows when the feed is late — ideally a visible "data last updated: [timestamp]" banner, not a silent blank.
A typical setup: appointment metrics refresh nightly with a freshness guarantee of no older than 18 hours by 8am. Billing metrics might refresh weekly because claims lag anyway, and pretending they're daily just creates noise. The point isn't to make everything real-time — it's to make the actual freshness visible and promised, so people know how much weight to put on the number.
Add a visible "data last updated: [timestamp]" banner to dashboards so users instantly know freshness.
Most clinics over-refresh the metrics that don't matter and under-monitor the ones that do. Booking counts feel urgent so they get refreshed constantly; meanwhile the denial pipeline breaks and sits stale for a full billing cycle because nobody set an SLA on it.
Layer four: lightweight validation checks
This is the layer almost every small clinic skips, and it's the one that actually protects trust. You don't need a data engineering team. You need a handful of cheap sanity checks that run automatically and flag when something's off.
Three categories cover most of what breaks:
Volume checks — did the number of rows suddenly change?
SELECT count() AS todaysappts, (SELECT avg(dailycount) FROM dailyapptcounts WHERE apptdate >= currentdate - 30) AS avg30d FROM appointments WHERE apptdate = currentdate; -- Flag if todaysappts < 0.5 avg_30d → feed probably broke If your clinic normally books around 60–80 appointments a day and the feed suddenly shows 4, the pipeline broke — not your patients.
Null and completeness checks — are required fields showing up empty?
SELECT count(*) AS missingcpt FROM chargelines WHERE servicedate >= currentdate - 7 AND (cptcode IS NULL OR cptcode = ''); -- Any value > 0 → investigate before trusting revenue metrics
Referential / logic checks — do the numbers contradict each other?
SELECT totalscheduled, (arrived + noshow + cancelled) AS accountedfor FROM apptstatusrollup WHERE period = 'lastweek'; -- If these don't match, a status is being dropped or double-counted
Here's a simple workflow that ties these checks into alerts, ownership, and the incident log.
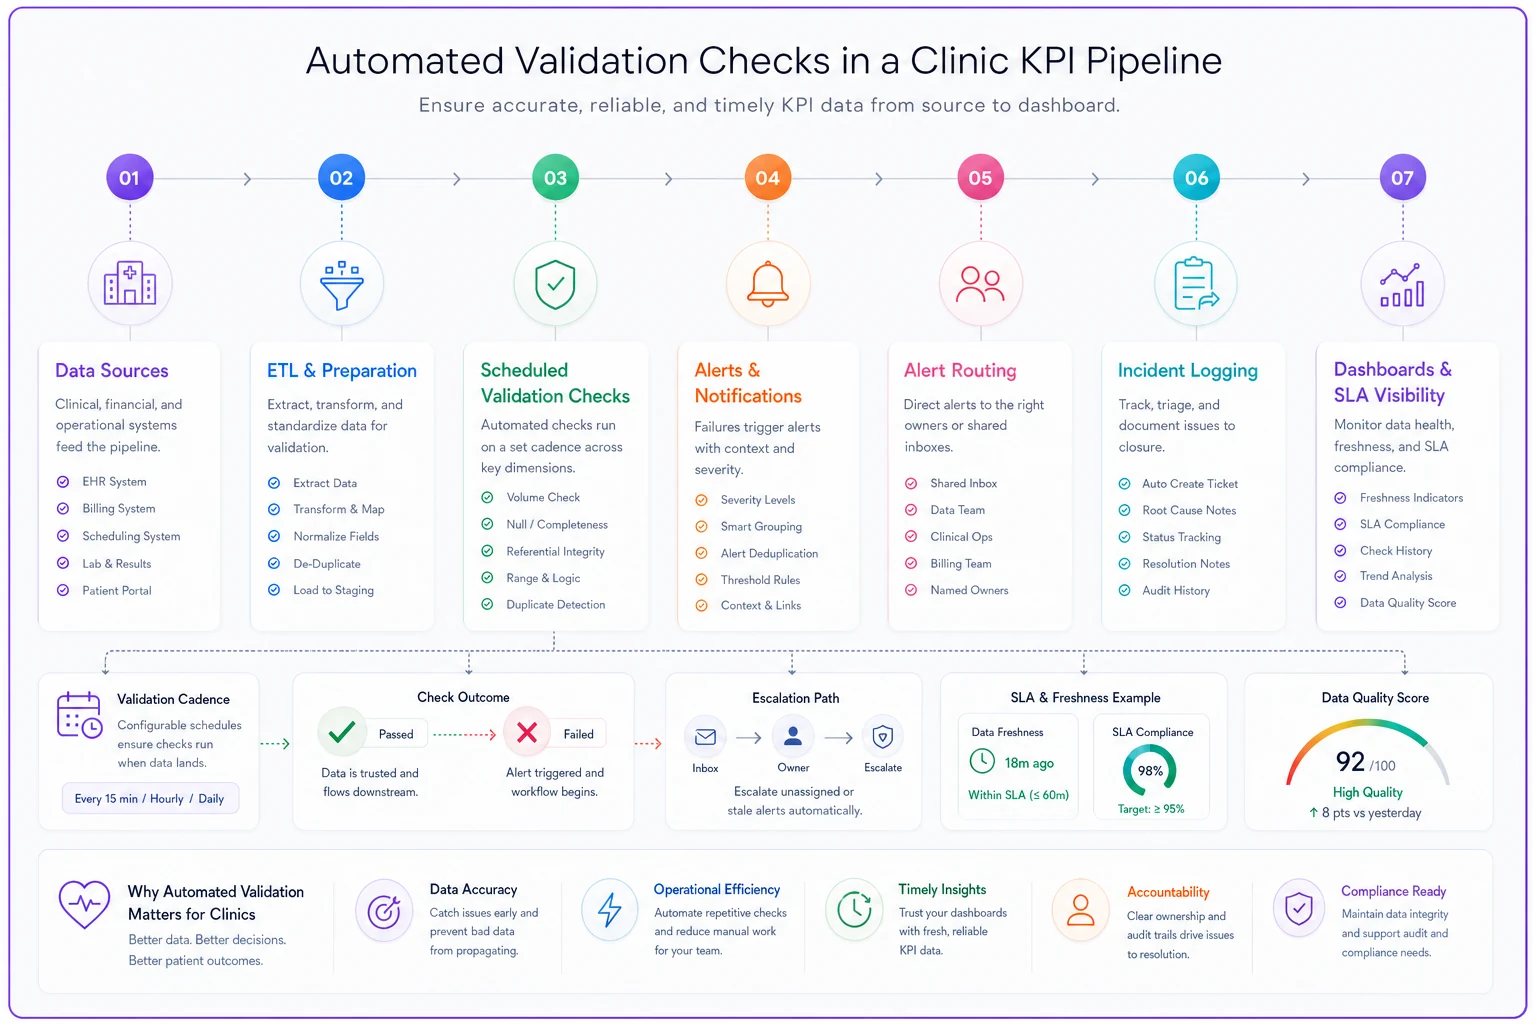
None of this is fancy. It's the data equivalent of the front desk double-checking the schedule before the day starts. The mistake people make is assuming they'll notice bad data on their own. You won't — a plausible-but-wrong number looks exactly like a correct one, which is precisely why bad data erodes trust so quietly.
Running these checks on a schedule and routing alerts to a shared inbox takes maybe an afternoon to set up. The ongoing cost is close to nothing. The cost of not having them is a meeting where someone torpedoes a decision because they don't believe the numbers.
The analytics incident log
Even with checks in place, things will break. What separates clinics that keep trust from clinics that lose it is whether they track the breaks.
-
Date detected and how it was caught (validation check, or a human noticed)
-
Which metric(s) were affected
-
Root cause — feed failure, definition change, EHR upgrade, manual entry error
-
Duration — how long the bad data was live before it was caught
-
Who was affected — which decisions or reports used the wrong number
-
Fix and prevention — what was done, and what check was added so it doesn't recur
Two things happen when you keep this log. Patterns surface — you'll notice, for example, that most incidents cluster right after EHR updates, which tells you to add validation runs to your update checklist. And more subtly, it rebuilds trust. When people can see that errors are caught, logged, and fixed transparently, they stop treating every number with suspicion. Admitting the data breaks sometimes is actually what makes people believe it the rest of the time.
A real scenario
A three-provider primary care clinic — roughly 330–360 visits a week — had a recurring problem in their monthly meetings. Their reported no-show rate bounced between about 6% and 14% month to month with no obvious cause, and leadership had basically stopped believing the number.
The root cause turned out to be layer one and layer four failing together. There was no written definition, so clinic-initiated cancellations were sometimes counted as no-shows depending on how the front desk closed out the appointment. And there was no validation check catching the inconsistency.
The fix took about a week of part-time effort: a written definition that excluded clinic-cancellations, a named owner (front desk lead as Responsible, practice manager as Accountable), a nightly refresh with a freshness banner, and a single reconciliation check confirming that arrived + no-show + cancelled matched total scheduled.
The no-show rate didn't magically improve — it settled around a consistent 9%. But that was the point. For the first time the number stopped swinging, and the team could actually start working on the real no-show problem instead of arguing about the measurement. Within a couple of months they'd brought it down a few points because they were finally acting on a number everyone trusted.
When this level of rigor makes sense — and when it doesn't
When it makes sense:
-
You have more than one location or more than a couple of providers
-
Multiple people pull reports and get different answers
-
You're about to make staffing or investment decisions based on metrics
-
Data feeds from multiple systems (EHR, billing, scheduling, CRM)
When it's overkill:
-
Solo practice where one person sees every number and every process
-
You genuinely only track 3–4 metrics and everyone agrees on them
-
You're pre-launch and don't have enough volume for numbers to mean anything yet
Who should not start here: If your clinic is still fighting basic operational fires — chaotic scheduling, no charge-capture discipline — fix the process first. A pristine taxonomy on top of broken operations just gives you very precise measurements of a mess. Get the underlying workflows stable, then build the measurement layer that keeps them honest.
Bringing it together
The reason a clinic KPI taxonomy works isn't that it produces prettier dashboards. It's that it makes the whole measurement system load-bearing. Definitions stop the arguments. Owner matrices put a name next to every number so it actually gets managed. Refresh SLAs kill the "is this current?" doubt. Validation checks and an incident log catch the silent failures that quietly poison trust.
Operational software helps here — a platform that centralizes these definitions, runs validation checks automatically, and timestamps every refresh removes a lot of the manual maintenance that makes teams abandon this work after a few months. But the tooling is secondary. The real shift is treating your metrics like a system that needs owners, guarantees, and quality control — not just a spreadsheet someone refreshes when they remember.
Start with your five most-argued-about metrics. Write real definitions. Name an owner for each. Add one validation check apiece. That alone will do more for your clinic's decision-making than any new chart you could add, because a number people trust is worth ten numbers they don't.
Start with your five most-argued-about metrics. Write real definitions. Name an owner for each. Add one validation check apiece. That alone will do more for your clinic's decision-making than any new chart you could add, because a number people trust is worth ten numbers they don't.
Ready to transform your practice workflow?
Join 2,000+ healthcare providers using GoCliny to increase efficiency, improve patient satisfaction, and grow revenue.