


Most small clinics treat eCQMs the same way they treat the fire extinguisher inspection tag. Someone signs off once a year, everyone assumes it's fine, and nobody looks at it again until something's on fire. Then it's December, the reporting deadline is looming, and a manager is manually pulling charts trying to figure out why the diabetes A1c control measure dropped to the low 60s when the clinic "definitely does good diabetes care."
The problem isn't clinical quality. It's that the measure lives in a report instead of in the workflow. A number on a dashboard at month-end tells you what already went wrong. By then the patients who should've gotten the retinal exam, the depression screen, or the follow-up BP recheck have already walked out the door.
This post is narrow on purpose. It's about one thing: taking a specific eCQM, breaking it down to the data elements that actually get captured during a visit, and wiring those elements into everyday steps — with owners, lightweight audits, and dashboards that push an action instead of just showing a sad red bar.
Why measures turn into paperwork in the first place
The root cause is almost always a gap between where the measure is defined and where the data is created.
-
The MA actually recording a BP, in the right field, with a cuff that fits
-
A repeat BP being taken and documented when the first reading is high (and documented in the discrete field, not the free-text note)
-
The provider coding the hypertension diagnosis so the patient lands in the denominator correctly
When a repeat BP gets typed into the visit note as "rechecked, 128/82, looks good" instead of entered as a structured vital, the measure doesn't see it. The clinic did the right clinical thing and still fails the measure. That single documentation habit, repeated across a panel, is enough to drag a numerator down by double digits.
This is the pattern across almost every eCQM that struggles: the care happened, the data element didn't get captured in the structured field the measure reads. Quality teams then spend the back half of the year doing chart abstraction to "find" care that was already delivered — which is the definition of turning a quality measure into paperwork.
Map the measure to the actual visit, element by element
Before you touch a dashboard, you need a one-page map per priority measure. Not the full spec — the operational version. Pick your three or four highest-stakes measures (the ones tied to payer incentives or your value-based contract) and break each down into: the data element, where in the visit it's created, who creates it, and what field it has to land in.
Eliminate appointment gaps and no-shows.
GoCliny streamlines every patient interaction from booking to billing—seamlessly.
- Unified appointment scheduling
- Automated patient reminders
- Staff calendar & task management
No credit card required
| Measure | Critical data element | Where it's created | Owner at point of care | Field it must land in |
|---|---|---|---|---|
| Controlling High BP | Repeat BP when first reading ≥140/90 | Rooming + end of visit | MA | Structured vitals, not note text |
| Breast Cancer Screening | Mammogram result/date | Pre-visit prep | Front desk / MA reviewing outside records | Discrete result, mapped to measure code |
| Depression Screening & Follow-up | PHQ-9 score + follow-up plan if positive | Rooming intake | MA (screen) + provider (plan) | Structured screening field + order/plan |
The insight most clinics miss: the failure point is almost never the provider's clinical decision. It's the handoff between who does the thing and who documents it in the structured place. In the depression measure specifically, clinics pass the screening step easily and fail the follow-up step constantly — a positive PHQ-9 generates a conversation but not a discrete, codeable follow-up plan. The measure can't see a conversation.
Once you have this map, you've converted an abstract denominator into a short list of concrete, assignable moments. That's the whole game.
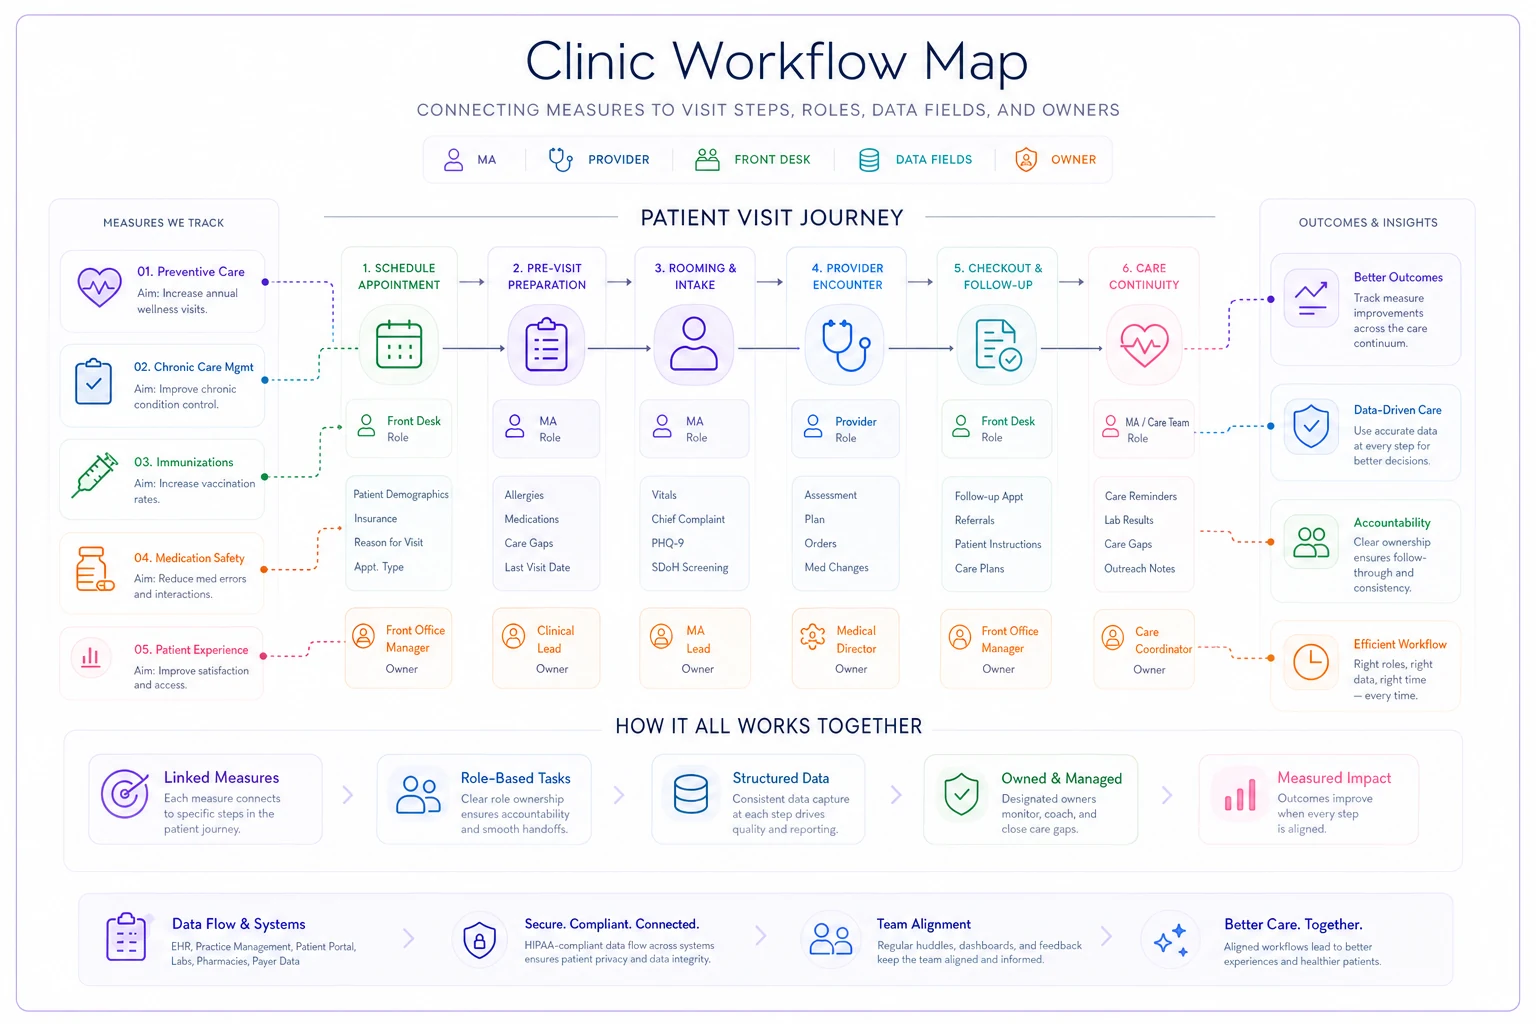
A simple visual of this map makes it easier to train staff and confirm who documents each field during the visit.
If you haven't already built a clean owner structure for your clinic's metrics, this mapping exercise pairs naturally with a proper clinic KPI taxonomy with owner matrices and lightweight validation checks — quality measures should live inside that same accountability structure, not in a separate silo nobody owns.
Lightweight audit sampling instead of year-end chart hunts
You don't need to abstract every chart. You need enough signal to catch a documentation habit before it rots an entire quarter.
What works in a small clinic is a small weekly sample, reviewed fast. The point isn't a perfect compliance percentage — it's catching the pattern early. Pull 8 charts a week against one measure and if 3 of them show the "high BP recorded, no repeat documented" problem, you don't need a bigger sample to know you have a rooming-workflow issue.
-
Pick one measure to focus on for the week (rotate through your priority set).
-
Pull 7–10 completed visits that should have hit the numerator.
-
Check only the one or two data elements that matter for that measure.
-
Tag each as
captured correctly, captured in wrong field, or not captured.
-
If more than roughly 30% fall in the last two buckets, that's a workflow signal — not a staff-scolding signal.
The common mistake is sampling failures — pulling the patients who missed the measure and trying to fix them retroactively. That's chart cleanup, and it never ends. Sample your process instead: look at how care got documented regardless of pass/fail, because the fix is upstream.
Log weekly sample results in a shared file so patterns are visible from week to week.
The other mistake is making the audit heavy enough that it only happens once a quarter. A quarterly 50-chart audit catches problems 10 weeks after they started. Ten quick charts a week catches them in seven days. Cadence beats depth here almost every time.
Owner SLAs: make someone responsible for the element, not the number
"Quality" as a shared responsibility means nobody owns it. The fix is assigning each data element — not each measure — to a specific role with a specific expectation.
-
MA SLA Any BP ≥140/90 at rooming gets a repeat reading before the provider enters, documented in the structured vitals field. Expectation: every eligible visit, same day.
-
Provider SLA Hypertension diagnosis coded at the visit it's identified. Expectation: before the encounter closes.
-
Manager SLA Weekly sample reviewed and results logged by Friday. Expectation: every week, no skipped weeks during busy stretches.
These are small, binary, and tied to a single moment in the visit — not "improve BP control by 5%." You can't put an SLA on an outcome the patient partly controls. You can put an SLA on whether the repeat reading got documented in the right field.
When owners are assigned to measures, performance drifts because responsibility is diffuse. When owners are assigned to specific data elements at specific visit steps, the number tends to move on its own — because the only reason it was broken was a missing structured element in the first place.
Evidence prompts at the point of care
The strongest lever is also the cheapest: a prompt that fires during the visit, while someone can still do something about it.
-
At rooming "First BP ≥140/90 — repeat reading required before provider entry." The MA sees it, re-cuffs, documents the structured repeat.
-
At pre-visit prep "Patient due for mammogram, no result on file in last 24 months — check for outside records." Front desk can reconcile before the visit.
-
At encounter close "PHQ-9 positive, no follow-up plan documented." Provider can't close cleanly without addressing it.
The difference between a prompt and a report is the difference between prevention and archaeology. A report tells you the mammogram result was never captured. A prompt at pre-visit prep means someone pulls it from the imaging center that morning and the measure never fails.
One caution: prompts rot fast when they're noisy. If every visit fires six alerts, staff learn to click through all of them. Keep prompts tied strictly to your priority measures and your known failure points from the audit. A prompt should be rare enough that it still means something when it appears.
Dashboards that trigger corrective actions, not just color
A dashboard showing CBP at 68% and trending down is informational. A useful dashboard answers "what do I actually do this week?"
-
Open gaps by measure, as a worklist "14 patients with uncontrolled BP and no documented repeat reading" → routed to MA lead.
-
Patients due but not yet captured, with a deadline "9 patients due for depression screening with upcoming visits this week" → prep list for rooming.
-
Documentation-location errors flagged from the weekly audit "BP recheck found in note text, not structured field — 3 instances" → coaching trigger, not a scolding.
The quiet failure mode of most quality dashboards is that they report the measure when they should be routing the gap. A manager looking at "72% screening rate" has no next action. A manager looking at "these 9 patients have visits Thursday and haven't been screened — here's the list" has a task they can finish before the week ends.
Pulling eligible-but-not-captured patients and routing them by owner is exactly the kind of repetitive data assembly that AI-assisted operational tools handle well — not to replace clinical judgment, but to remove the Monday-morning spreadsheet pull that quietly never happens during a busy week. The care decision stays human; the gap-finding gets automated.
A real scenario
A two-provider family medicine clinic, roughly 320–360 visits a week, was sitting in the low 60s on their BP control measure despite genuinely good clinical care. Their value-based contract had a bonus threshold they kept missing.
The weekly audit told the whole story in about three weeks: in roughly a third of high-BP visits, a repeat reading was taken but typed into the note, so the measure never counted it. The care was fine. The data element was in the wrong field.
The fix was unglamorous — an MA SLA for structured repeat readings, a rooming prompt that fired on a first reading ≥140/90, and a weekly 8-chart sample to confirm the habit was sticking. No new clinical protocols, no extra staff.
Over the next two quarters the measure climbed into the mid-to-high 70s. Not because the clinic suddenly treated hypertension better, but because the care it was already delivering finally showed up where the measure could see it. The bonus threshold went from "missed again" to comfortably cleared.
When this approach makes sense — and when it doesn't
When it makes sense: You're in a value-based or incentive contract, you have a handful of measures that matter financially, and your clinical care is already decent but your numbers don't reflect it. That gap is almost always documentation and workflow, and this approach fixes it faster than anything else.
When it's overkill: A tiny practice with no value-based exposure and purely informational measures doesn't need SLAs and weekly audits for every measure. Pick one that matters and stop there.
Who should NOT do this: Don't layer prompts and audits onto a clinic that hasn't fixed its clinical gaps first. If patients genuinely aren't getting screened, no amount of documentation routing fixes that — you have a care-delivery problem, not a data-capture one. Audit first to figure out which one you actually have. The weekly sample exists to answer exactly that question: is this a "wrong field" problem or a "didn't happen" problem? Those have completely different fixes.
It's also worth understanding the real cost of the manual scramble you're already running. If a staff member spends days each quarter abstracting charts to recover care that was already delivered, that's expensive hidden labor — the kind that a time-driven activity-based costing lens makes painfully visible once you actually add up the hours.
The shift that actually matters
The clinics that stop drowning in quality paperwork aren't the ones with the fanciest reporting. They're the ones who moved the work upstream — from year-end abstraction to point-of-care capture, from measures-nobody-owns to elements-someone-owns, from dashboards that display problems to worklists that route them.
Start with one measure. Map its two or three critical data elements to the exact visit steps where they're created. Assign an owner to each element. Run a small weekly audit to confirm the habit is holding. Add one prompt at the moment the element gets captured. That's the whole system, and it's small enough to stand up in a couple of weeks.
Everything else — more measures, more automation, tighter dashboards — is just repeating that same loop on the next priority. Get it right once, and clinical quality stops being a December panic and starts being something that just happens, quietly, in the rooms where care is already being delivered.
Everything else — more measures, more automation, tighter dashboards — is just repeating that same loop on the next priority. Get it right once, and clinical quality stops being a December panic and starts being something that just happens, quietly, in the rooms where care is already being delivered.
Ready to transform your practice workflow?
Join 2,000+ healthcare providers using GoCliny to increase efficiency, improve patient satisfaction, and grow revenue.