


Most practice managers can tell you last month's collections down to the dollar. Ask them what next March looks like — with the payer mix shift after open enrollment, the spring physical rush, and the collections lag from a Medicaid backlog — and things get vague fast. "Probably similar to last year" is the answer you hear most often. That's the whole problem.
A clinic revenue forecasting model isn't a spreadsheet that predicts the future perfectly. It's a system that connects the inputs you actually control — how many appointments you book by type, who's paying for them, and how long the money takes to land — into a picture you can act on before the month happens instead of explaining it afterward.
The clinics that struggle here aren't bad at math. They're missing the connective tissue between three things that live in three different places: the schedule, the payer contracts, and the collections timeline. When those live apart, forecasting becomes a monthly guessing ritual. When they live together in one reproducible workbook, it becomes a decision tool that tells you when to add a float provider, when to hold off on a supply reorder, and when to worry.
The three inputs that actually drive the forecast
Everything else is noise on top of these three. Get these modeled honestly and you're already ahead of most practices.
Appointments by type. Not total appointment count — that number lies. A new-patient comprehensive visit, a routine follow-up, and a procedure day are three completely different revenue events. A practice doing 340 visits in a month can swing $15k–$20k in collected revenue depending on how that 340 splits across visit types. If your model treats every appointment as one unit, you've already lost the plot.
Payer mix. This is the input people most often flatten into an average. "We collect about 62% of billed" feels precise, but that blended number hides the fact that your commercial visits reimburse fast and clean while your Medicaid line drags and denies. When your payer mix shifts even five points toward the slower payer — which happens quietly after open enrollment — your collected revenue and your timing both move, and a blended average won't show it.
Collections lag. The gap between service and cash. Commercial might land in 18–25 days, Medicaid in 45–70, patient responsibility whenever the third statement finally works. Most forecasts assume the money shows up the month the service happens. It doesn't. This single wrong assumption is why so many clinics feel "profitable but broke" in certain months.
The pattern worth internalizing: appointments by type sets your billed revenue, payer mix sets how much of it you keep, and collections lag sets when it actually arrives. Miss any one and the forecast becomes decorative.
What a reproducible workbook actually looks like
The word that matters most is reproducible. A one-off forecast someone built in a heroic weekend of formulas is worthless three months later when that person is out and nobody remembers which cells were hardcoded.
Eliminate appointment gaps and no-shows.
GoCliny streamlines every patient interaction from booking to billing—seamlessly.
- Unified appointment scheduling
- Automated patient reminders
- Staff calendar & task management
No credit card required
A workbook you can rerun every month with fresh inputs and get a trustworthy answer — that's the goal. Structurally it breaks into layers:
| Layer | What it holds | Who touches it |
|---|---|---|
| Inputs | Appointments by type, payer mix %, expected volume per provider | Front office / scheduling lead |
| Assumptions | Reimbursement per visit type by payer, collections lag by payer | RCM / billing owner |
| Engine | Billed → expected collected → timed by lag month | Locked, nobody edits |
| Scenarios | Toggles for volume, mix, and lag shifts | Practice manager |
| Outputs | Monthly collected forecast, sensitivity, action triggers | Everyone reads |
Lock the engine and keep the inputs in a clearly labeled 'Inputs' sheet so monthly reruns are simple and auditable.
The mistake that comes up constantly is people mixing the input layer and the engine layer in the same cells. Someone overwrites a formula with a typed-in number to "fix" a month, and now the model is quietly broken and nobody knows it. Keep the engine locked. Keep the inputs obviously editable. That separation is boring to enforce and it's the reason the thing survives past quarter one.
The layered structure works because it forces accountability. When an input changes, you know who owns it and where it lives. When the output looks wrong, you trace back through defined layers instead of digging through a tangle of formulas someone half-remembers building.
Building the seasonality layer without overfitting
Seasonality in clinics is real but lumpier than people expect. Pediatrics has a brutal August–September physical and vaccine surge. Derm has a spring mole-check bump. Primary care has a January deductible-reset slowdown where patients delay anything elective because they're back to paying full freight.
The trap is building seasonality off one year of data and treating every bump as a rule. A single bad flu season or a provider's maternity leave can distort a month enough to poison next year's forecast if you copy it forward blindly.
A cleaner approach: build seasonality as a percentage adjustment to a baseline month, not as absolute numbers. Instead of "March = $71k," carry "March runs about 8–12% above baseline volume, weighted toward new patients." When your baseline changes — new provider, new location — the seasonal shape still applies. Absolute seasonal numbers rot the moment your practice size changes. Percentage shapes travel.
Keep the January deductible effect separate from pure volume seasonality. In January you might have the same visit count but a lower collected total because more of it lands as patient responsibility with its longer lag. That's not a volume story, it's a mix-and-lag story. Folding it into "January is slow" hides what's actually happening.
How the forecast model flows
Understanding the full forecasting cycle helps clarify where each input feeds each output. At a high level, the process moves in one direction:
-
Scheduled appointments (by type and provider) feed the volume input
-
Volume by type, multiplied by reimbursement rates per payer, generates billed revenue
-
Payer mix percentages determine how much of billed revenue becomes expected collected revenue
-
Collections lag by payer shifts expected collected revenue into the month it actually lands as cash
-
Scenario toggles stress-test the output across volume, mix, and lag assumptions
-
Action triggers fire based on output thresholds — staffing calls, supply timing, cash floor alerts
Each stage depends on clean data from the previous one. That's why garbage inputs aren't just imprecise — they produce confident wrong answers that people actually plan around.
Here's a simple visual to keep the flow clear.
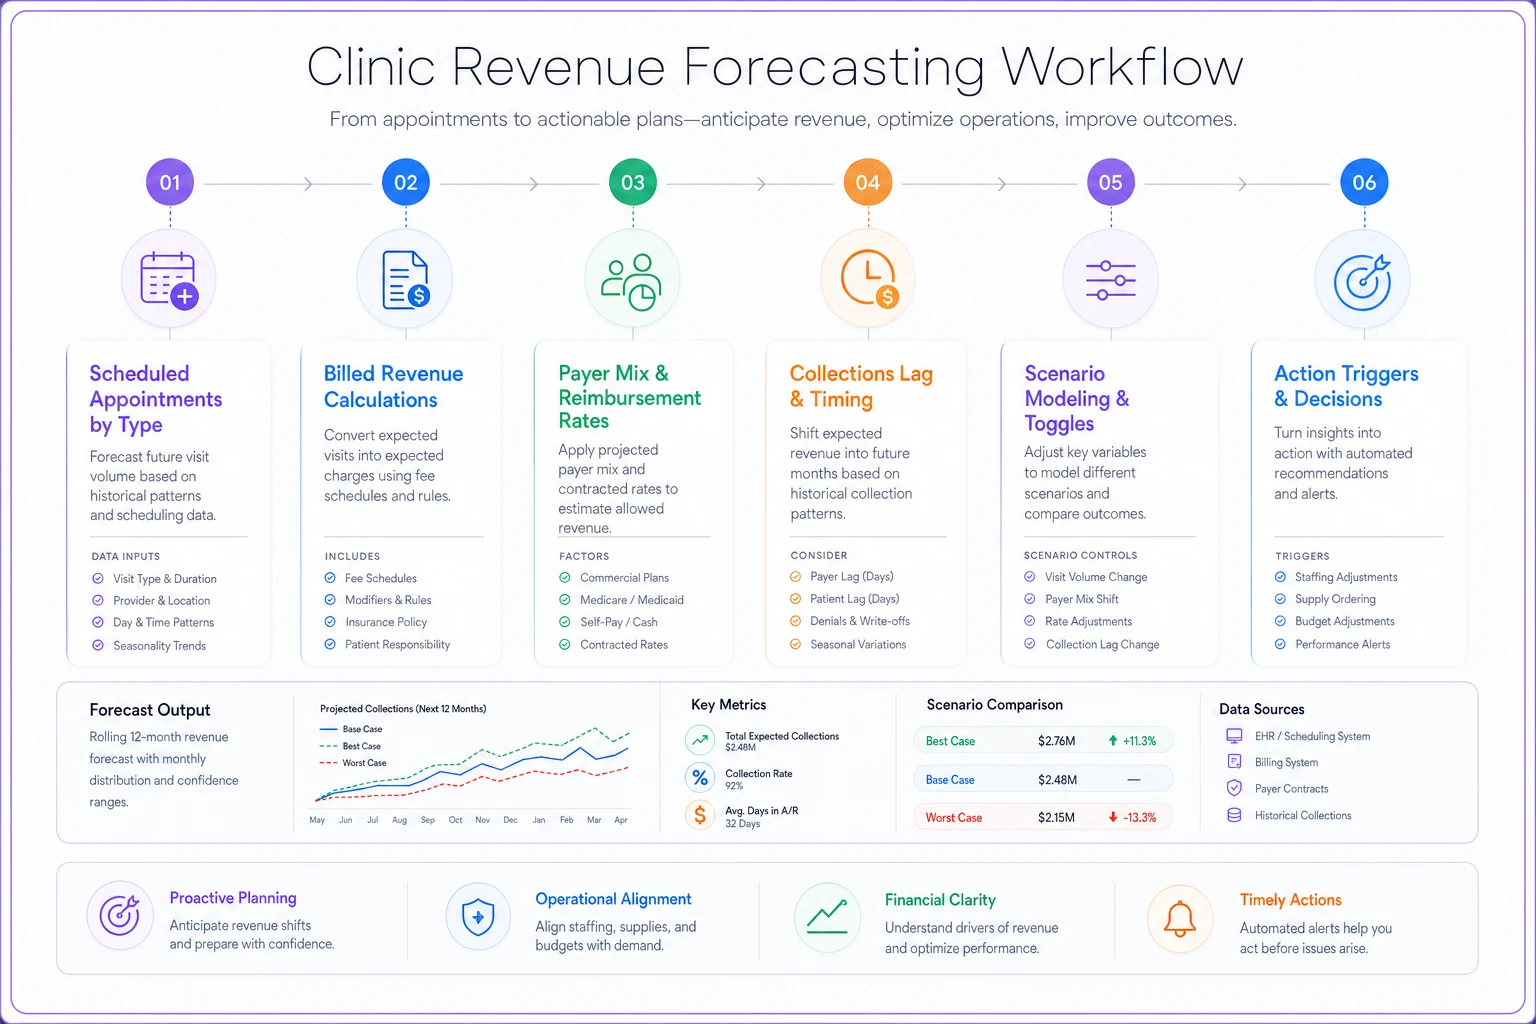
A clear workflow image makes it easier to walk stakeholders through where the numbers come from and why timing matters.
Scenario toggles: where the model earns its keep
A forecast with one number is a prediction. A forecast with scenario toggles is a planning tool. The difference matters when you're deciding whether to commit to a locum contract in February.
-
Volume toggle — what if appointments run 10% under or over plan? (Provider out, marketing push landed, referral source dried up.)
-
Mix toggle — what if payer mix shifts 3–5 points toward your slower payer? This is the open-enrollment shift, quietly modeled.
-
Lag toggle — what if a payer's collections stretch by 15 days? This covers a payer changing systems, a clearinghouse hiccup, or a denial spike.
The insight most people miss: these toggles don't just change how much, they change when. A mix shift toward Medicaid might barely dent your billed revenue but push $8k–$12k of collections from one month into the next. If you only look at annual totals, everything looks fine. If you're managing cash to make payroll, that timing shift is the whole ballgame.
Run a base, a conservative, and a stretch scenario every month. Not to obsess over which is "right" — to know your floor. Knowing your worst realistic month is what lets you make staffing and supply commitments without white-knuckling it.
Sensitivity analysis: which input hurts you most
Not all inputs deserve equal attention. Sensitivity analysis answers one question: if I'm wrong about something, which wrong assumption costs me the most?
For most clinics the answer is surprising. People obsess over total volume, but volume is usually the thing they forecast best — they can see the schedule filling. The inputs that quietly wreck forecasts are payer mix and collections lag, precisely because they're invisible until the cash doesn't show up.
-
Volume ±10% → roughly a $6k–$9k monthly swing
-
Payer mix ±4 points → roughly a $4k–$7k swing, but with timing effects
-
Collections lag +15 days on your slow payer → possibly no annual change but a painful single-month hole
When you rank those, you learn where to spend attention. If lag is your biggest sensitivity, the fix isn't better forecasting — it's a tighter denial and follow-up process on that payer. The forecast just pointed you at the real operational leak. That's where a forecasting model stops being a finance exercise and starts acting like an operations diagnostic.
Turning the forecast into action triggers
A forecast nobody acts on is just anxiety with formatting. The point is to wire specific outputs to specific decisions so the model drives action instead of waiting to be interpreted.
Tie triggers to staffing and supply — the two biggest levers you actually control month to month.
Staffing triggers:
-
Forecasted new-patient volume in a month exceeds X → open a locum/float conversation now, not three weeks in
-
Conservative scenario collected revenue drops below your payroll and overhead floor → hold any planned hire, revisit next cycle
-
Procedure-day volume forecast climbs → confirm clinical support staff is lined up, not just providers
Supply triggers:
-
High-volume visit type forecast surges → pre-order consumables tied to that visit type before the rush, not during
-
Volume forecast softens for a slow month → delay the bulk supply reorder to protect cash during the lag valley
The connection people miss is that staffing and supply decisions have their own lead times that rarely match the forecast horizon. A locum needs weeks of credentialing. A bulk supply order has a delivery window. If your trigger fires the month the surge hits, you're already too late. Good triggers fire on the forecast, not the actual — that's the entire reason to build the model.
A real scenario
A three-provider primary care practice running roughly 330–360 visits a month kept getting blindsided by February and March. Revenue on paper looked steady, but cash felt tight enough that they twice delayed a much-needed part-time MA hire.
When they built out the inputs properly, the culprit was obvious. January's deductible reset pushed a chunk of visits into patient-responsibility, which lagged 60+ days. So January and February services collected as cash in March and April — right when they were also spending on the spring physical supply bump. The revenue wasn't the problem. The timing was, and a blended-average forecast couldn't see it.
Once they modeled payer mix and lag separately and added a conservative scenario, they could see the cash valley coming about eight weeks out. They shifted the MA start date by three weeks, delayed one supply reorder into a stronger collections month, and stopped treating February like a mystery. No revenue miracle. Just a few thousand dollars of timing pressure relieved and a hiring decision made with confidence instead of dread.
When this actually makes sense to build
Build this if you have more than one payer type at meaningful volume, real seasonality, or a collections lag long enough that cash and revenue drift apart. Most multi-provider clinics hit all three.
When it's overkill: a single-provider cash-pay or heavily commercial practice with fast, clean collections doesn't need scenario toggles and sensitivity layers. The lag is short, the mix is simple, and a lightweight monthly estimate is plenty. Building a full model there is effort you'll never recoup.
Who should not start here: if your appointment-type data is a mess or your billing owner can't tell you real reimbursement-per-visit by payer, fix that first. A forecasting model built on garbage inputs is worse than no model — it produces confident wrong answers that people actually plan around. Get your underlying data honest before you build the engine on top of it.
How this connects to the rest of your operation
A forecast doesn't live alone. It pulls from your scheduling system, your payer contracts, and your collections process, and it pushes into staffing and purchasing. That's a lot of handoffs, and every handoff is where the model either stays fresh or quietly goes stale.
The clinics that keep a forecasting model alive are usually already tracking the right operational metrics, because the forecast just reads from data they're maintaining anyway. If you haven't sorted out which numbers actually drive decisions, that's the real starting point — this piece on which KPIs actually move the needle covers how to build the dashboard your forecast feeds from.
On the collections-lag side, the biggest lever is often patient-responsibility timing. Tightening estimates and point-of-care collection shortens that lag and makes the forecast both smaller in variance and easier to trust — the approach in making patient payments predictable directly improves the lag input this model depends on.
The real point
A clinic revenue forecasting model isn't about predicting revenue to the dollar. It's about seeing the shape of your cash before it arrives — the seasonal bumps, the payer-mix shifts, the lag valleys — early enough to make staffing and supply calls with lead time instead of panic. The math is the easy part. The discipline is keeping three inputs honest, separating the engine from the assumptions, and wiring the outputs to actual decisions.
Do that consistently, and February stops being a mystery. You stop reacting to your own numbers and start running ahead of them.
A clinic revenue forecasting model isn't about predicting revenue to the dollar. It's about seeing the shape of your cash before it arrives — the seasonal bumps, the payer-mix shifts, the lag valleys — early enough to make staffing and supply calls with lead time instead of panic. The math is the easy part. The discipline is keeping three inputs honest, separating the engine from the assumptions, and wiring the outputs to actual decisions.
Do that consistently, and February stops being a mystery. You stop reacting to your own numbers and start running ahead of them.
Ready to transform your practice workflow?
Join 2,000+ healthcare providers using GoCliny to increase efficiency, improve patient satisfaction, and grow revenue.